
This year was the first time that I ever competed in a RStudio Shiny competition by submitting my first ever Shiny app, the TarotreadR. For those of you that read one of my previous blog posts “How I Became a ‘Not-Beginner’ in R”, you’ll know that I tried to make Shiny apps first before doing anything else in R and RStudio. This was before I tried learning basic programming in, or even learning how to load data into, the RStudio environment. I can credit Shiny with being the reason why I almost gave up on learning R and almost did not make a transition into the field of data science.
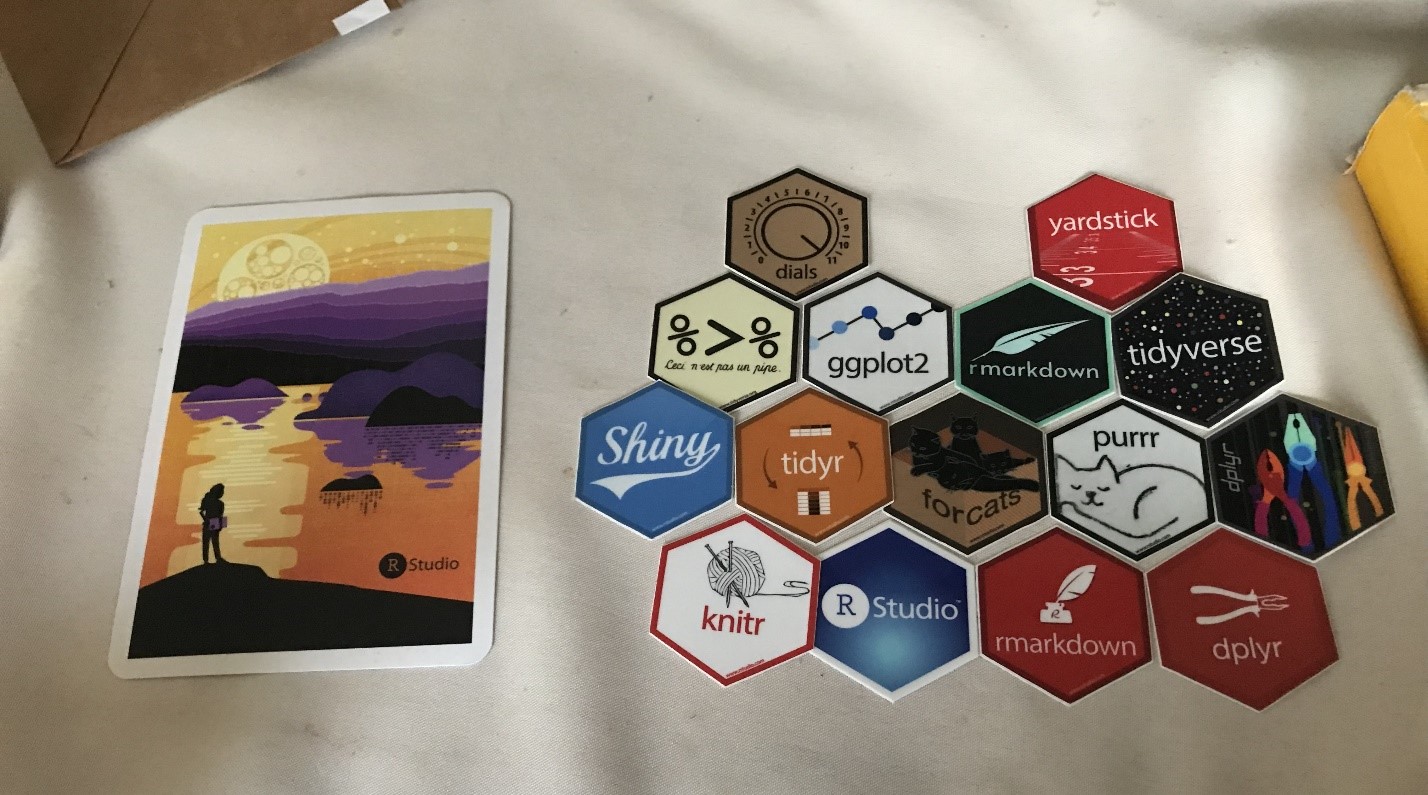
Now fast forward about 2-3 years to present day; I can comfortably say that I still know so little about Shiny. In March of this year, RStudio’s 3rd Annual Shiny Competition was first announced and, for some reason, I felt compelled to face my fears and enter the competition. The thought of competing was honestly terrifying and daunting because I had never worked in Shiny— well, besides my first failed attempt over 2 years ago. Just like in the past with my machine learning experiences, every time I tried to get started with reading materials about creating my own app in Shiny, I would just freeze up mentally. Everything always seemed overwhelming, and I could never understand how people could create such amazing and intricate apps just using Shiny. Despite all of this, I somehow managed to pull together a working app. The process involved a lot of resources, a lot of time, some tears, and some sleepless nights. Although I got no honorable mentions or placements in the competition, I have to say that it is something I am extremely proud of. Plus, I also got my first hex stickers for free so I can’t complain at all!
A few months ago, I could never have imagined that I would be able to create a working app that I made by myself in Shiny. The TarotreadR isn’t the best app and might not be the most creative, but it is something that is a huge accomplishment for me. Especially so because it was made in about three months with no prior Shiny experience. I wanted to take the time to talk about this process of creating the TarotreadR and what I learned from the experience, so let’s dive in!
The Idea
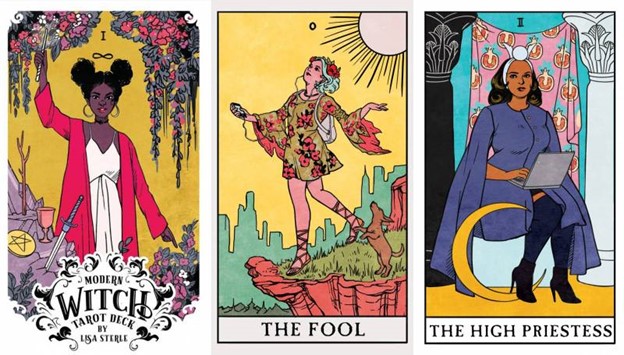
My TarotreadR idea was thought up before the Shiny competition this year. Recently, I’ve personally become interested in tarot cards (and was gifted The Modern Witch Tarot Deck by Lisa Sterle.) This is not because I was planning my career transition into tarot reading, but because I grew fond of the different art styles that different decks can have. I find it so interesting to look at how artists’ interpretations of these decks vary. I must also admit that I do like pulling cards for myself from time to time. I find that some people get surprised when I tell them that. I’m viewed as this highly analytical person that works in data science and “real things.” For me, I liken reading cards to using a fidget spinner in some sense.
As a mental health advocate, I’ve always been open about my mental health struggles and I must say that sometimes pulling tarot cards prompts me to use the Barnum Effect to my advantage by creating some distance from my anxious thoughts. This gives me the space to acknowledge what I already know within me. Being that I started doing this more frequently, I wanted an app that could spell out full interpretations of groups of tarot cards based on what was pulled. Interpreting tarot cards can get messy and confusing if you start doing more than one, and if you allow them to be reversed. It can get complicated because a reversed tarot card can have subtle but key differences in interpretations when compared to upright cards. So, given that I was already interested in this and wanted to do it, the idea of a simpler app, the TarotreadR, was born.
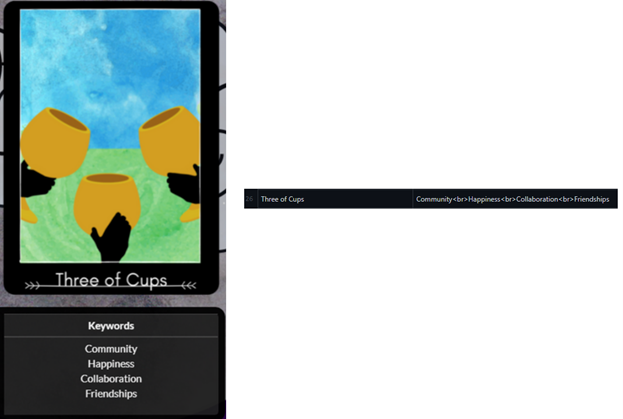
Instead of making fully tailored interpretations, the app would randomly pull cards for the user and give them keywords for each card based on if the card was upright or reversed. To get started with this, I wanted to do the tasks that I thought would take the longest: making the card images and creating tarot card data.
Making the Card Art and Data

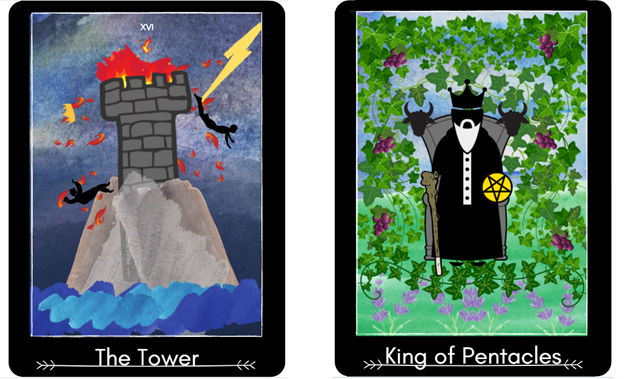
The process of making the card art was a bit daunting but something I really wanted to do. The original tarot deck consists of 78 cards in total. Making the card art did take about 2 months over the course of a few sessions. It was the perfect time to get some use out of my Pro Canva account. I created each image by “collaging” various icons, graphics, and shapes together. This was a tedious process as it required thinking outside of the box to get the shapes and figures I wanted. The hardest part was trying to keep the figures (human silhouettes) consistent. Let’s just say I like some cards more than others.
While I was making the card art, I was also creating a dataset to go with it. For an app like this, the dataset was straightforward. I would just need three variables: The card’s name, the associated keywords (card meanings), and the position (upright or reversed/upside down) of the card. I used a combination of published meanings from biddytarot.com and labyrinthos.co to fill in the keywords of each card. This process also took about a few months as I only filled in the data once I completed the art for the card.
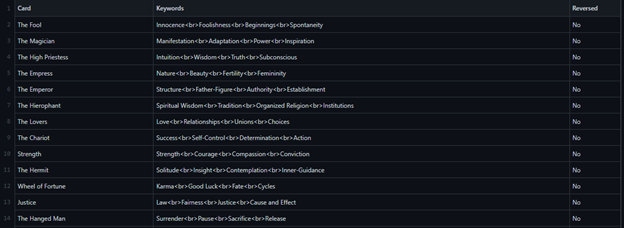
Creating the dataset was an iterative process. While I was working on the cards and data, I did start to think about the app structure. Trial and error eventually lead to me figuring out that the text in the “keywords” variable could be in plaintext HTML. This required me fixing the data to follow plaintext HTML and to then introduce line breaks in the UI of the app when keywords were displayed.
After I had a good foundation going with the cards and dataset, I had to finally face my fears and start trying to build the app in Shiny. I thought the best way to do this would be to try to wrap my head around the Shiny environment. I would be lying if I said I wasn’t terrified.
Understanding the Shiny Environment and Reactivity

Spoiler Alert: this part was actually not that bad! The worst is designing your app to make it look pretty and I’ll get to that nightmare shortly. If you’ve read one of my previous R walkthroughs, Making Dull Dashboards, you may recall me talking about the concept of reactivity when creating flexdashboards. The concepts I learned using the Crosstalk and SummaryWidgets packages to make flexdashboards prepared me to comprehend how the Shiny environment works. While I am still a Shiny noob in my mind, it’s definitely not as scary when you have a basic understanding of how the two major components of a Shiny app work together.
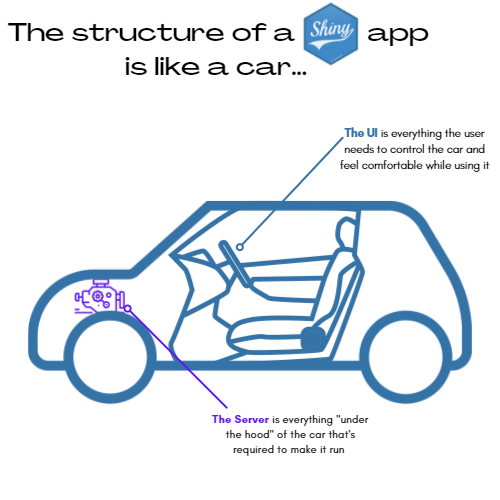
I think of a Shiny app as if it were a car made of two main components: the Server and the UI (User Interface). I think of the Server as everything under the hood of the car: the engine, fuel tank, electrical system, etc. I think of the UI as the frame of the car, the seats, the steering wheel, and anything else I would need to comfortably control the car.
I think of it this way: there’s a bare minimum that’s required for a car to turn on and operate. This is like having functions in your Server that, at its bare minimum, will allow the app to operate regardless of efficiency or the warnings that we might ignore in the console while our app is deploying. At its bare minimum, the UI should similarly be able to give the user basic functionality. In our car comparison this could be something as simple as making sure the car has a working ignition and a steering wheel. In the same sense, while our cars can operate with these bare minimums, we’d prefer to not see a check engine light, we’d prefer seat belts, and maybe some nice leather seats to sit on.
Once I started thinking about Shiny apps this way, I realized the importance of the interaction between the UI and the Server. I’m very excited to build from this knowledge to make better apps in the future, but for now, this basic understanding was all I needed to make the TarotreadR happen.
Designing the UI
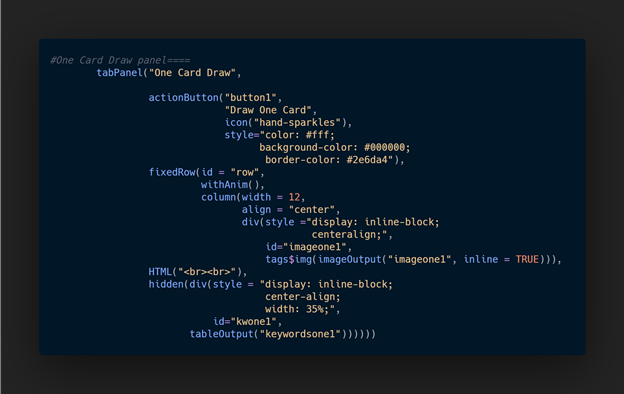
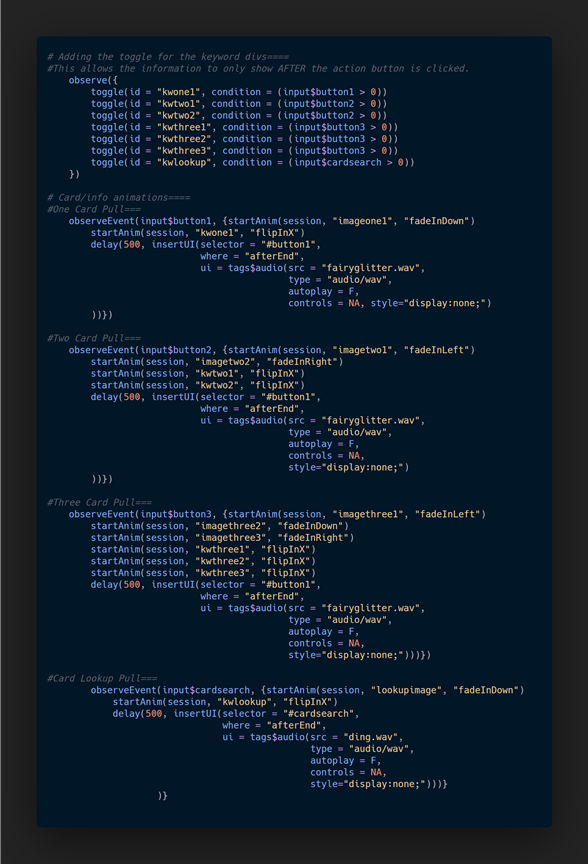
Creating the UI was also an iterative process. It seemed I was constantly going back and forth between the UI and Server through trial and error. I expected this as I was essentially teaching myself as I progressed. One of the biggest challenges was learning that it’s REALLY helpful to have some knowledge of HTML, CSS, and even JavaScript when designing a Shiny app’s UI. While it’s not required to make an app functional, it is required to make an app pretty. I had a vision of what I wanted the app to look like, and to get that vision, I definitely had to spend some nights refreshing my HTML skills and learning new skills in CSS and JavaScript. These backgrounds were needed to figure out small things like not having cards appear until a user has clicked on an action button and having the cards animate onto the screen when a user “pulled” them.
Another challenge was figuring out spacing and sizing. It required thinking about the app and its components in a modular fashion. Boxes within boxes, if you will. Again, trial and error was my best friend here. The code you see above is a “Frankenstein” masterpiece that came to be after many iterations and failed deployments.
Setting Up the Server
Besides trying to teach myself CSS and minimal JavaScript in less than a month, one of the most difficult things about building the TarotreadR was figuring out the Server component. I needed to figure out how to randomize cards being pulled, but I also needed to get images to show up in the UI based on those randomizations. Things get even more difficult once you add in the reversed card positions.
My original thought was to only make the deck of cards one time and then figure out how to get the images to display in a reversed position programmatically. In my darkest hour, I gave up trying to figure out the CSS to make this happen. Every time I thought I had the answer, the image would somehow be off and not displaying correctly. In that moment, I shed a tear, closed RStudio, and opened up Canva and proceeded to make “reversed” images for each of the cards. In retrospect, I really wish that I would have stuck it out as it might have improved the TarotreadR’s performance (instead of loading 78 card images, it was now loading 156 card images for upright and reversed positions).
Having separate images did end up working for me with the help of this post by Jeroen Ooms. Once I got over the biggest hurdle of getting the images to display properly, I was able to add things like toggling (so that cards are only shown after a button is clicked) and sounds that play with the card animations.
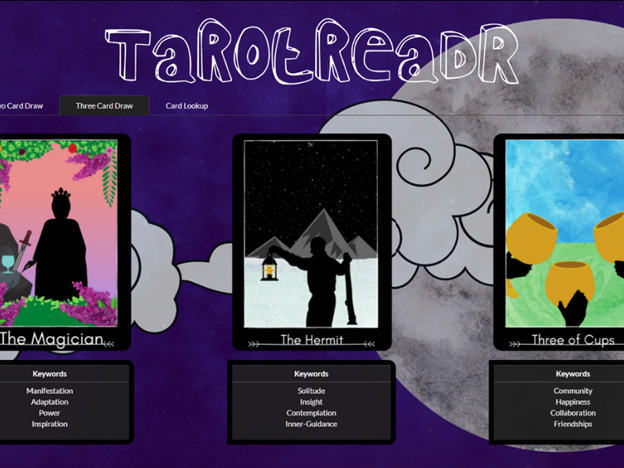
Putting It All Together
Finally, after about three months, all of the work paid off! I finally finished all of the cards, completed all of the data entry, got the UI and Server to talk to each other, and successfully deployed the TarotreadR to Shinyapps.io. If you haven’t seen it action and would like to, you can here.
If you’d like to see the full code and files used to make all of this, you can find it in my Github Repo here.
Lessons Learned
After this whole experience, my professional and personal life got extremely hectic, and I didn’t get a chance to really talk about this publicly (which is what prompted this post). There are a few lessons I’ve learned that I want to highlight:
CSS, HTML, and JavaScript are crucial to making attractive UIs (in my opinion).
Sometimes it’s OK if your code is not the most efficient. You can still get your app to work – but it is in good practice to try and revisit the code to improve it if possible.
Flexdashboards, Crosstalk, and SummaryWidgets are absolutely the reason why I was able to do all of this in three months. Learning these packages can ease you into understanding how app reactivity works.
I have even more respect for web devs and those that make Shiny apps for a living (I already had a lot of respect for you guys, now it’s just astronomical).
Shiny isn’t all that scary once you slow down and take the time to understand the environment.
Have you ever made Shiny apps before? Do you have “Shinyphobia” like I did? Are you screaming at the inefficiency of my program? (I know, I’m sorry!) Feel free to contact me directly! Respectful discourse towards efficient solutions or new insights is always welcomed!